What is R?
R is a tool for statistical computing and data visualization. R uses its own programming language, giving the user significant control to manipulate data and create powerful visuals. R’s capabilities are virtually limitless because you can add packages that other users have created, as well as the ability to create your own. It provides a free alternative to software like SPSS and STATA, and it is increasingly used in a wide variety of disciplines.
You can use R to organize, visualize, and perform calculations on large datasets. R is exceptionally well-documented with a number of useful resources available, and unofficially supported capabilities are possible via user-defined functions and packages.
View Module as PDF
1. How to Install
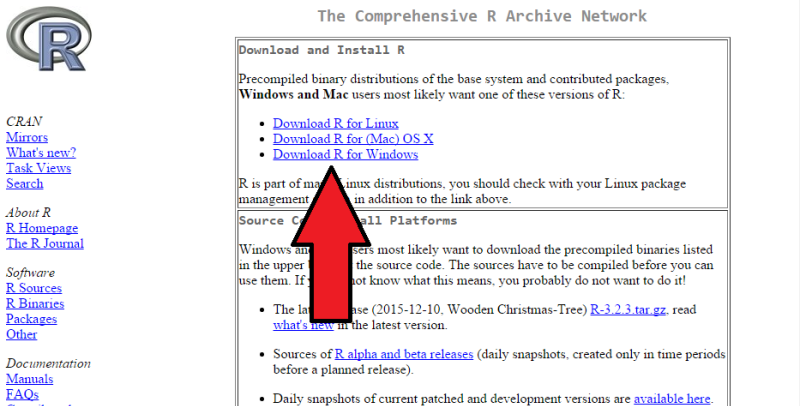
- Visit http://www.r-project.org/ and click on the hyperlinked text “download R” under the section labeled Getting Started.
- Select your preferred mirror. It is recommended that you choose one close to your location.
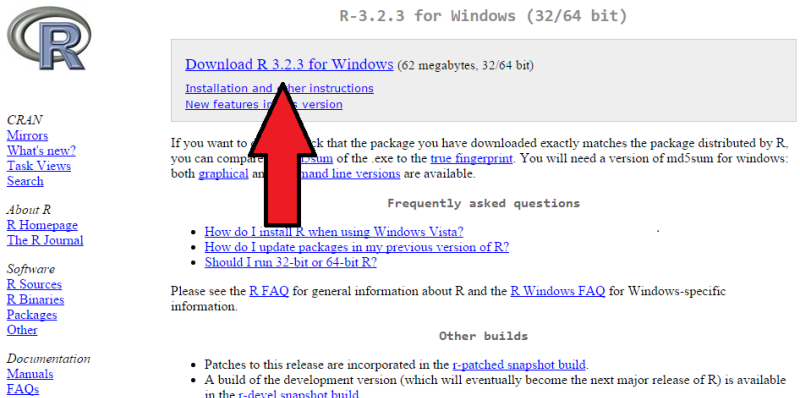
- Select your platform.
Mac Users:
- Select the appropriate .pkg file depending on your version of OS X and download it. If you are unsure of which version you are running, click on the Apple icon in the top left of your desktop and select “About This Mac.” Under OS X it will list your version.
Windows Users:
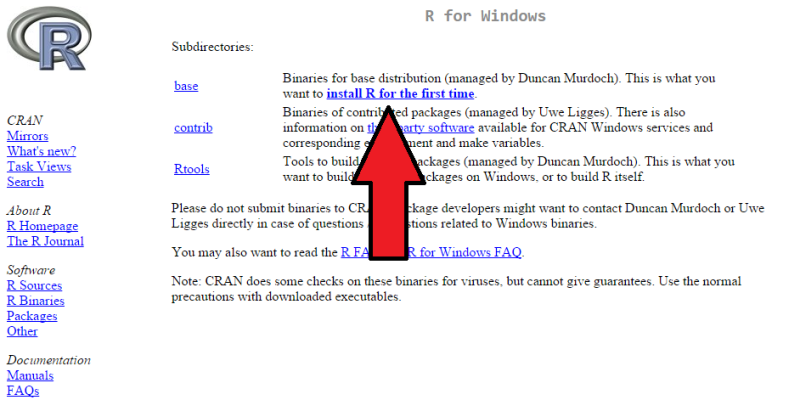
- Select “Install R for the First Time” and then “Download R 3.x.x for Windows” (actual version number for R will change as it’s updated)
- Run the .pkg or .exe file and follow the onscreen instructions to complete the installation.
- For troubleshooting or more specific needs, consult the FAQ at http://cran.stat.ucla.edu/
2. SSRMC Workshop
This workshop walks students through the very basics of R, from loading in data to basic data visualization. While the workshop is only taught live once a year, all the resources for the workshop (including videos of Professor Settle teaching it) are available here.
3. Getting Started with R
One of the downsides of learning R is that there are large “start up” costs. However, there are many resources available to you to learn independently. The short video below can help you get started.
https://www.youtube.com/watch?v=LjuXiBjxryQ
4. Resources on the Web
The “Try R” tutorial walks you through the syntax of R. Each lesson must be completed before you advance to the next. By the end of the course, you’ve been exposed to vectors, matrices and data frames in R, as well as basic summary statistics.
Coursera offers a free course that covers basic programming in R, reading data into R, accessing R packages, writing R functions, debugging, profiling R code, and organizing and commenting R code. Coursera recommends that you first take its “Data Scientist’s Toolbox” course to introduce you to the concept of turning data into actionable knowledge.
The College also subscribes to Lynda. Lynda’s R Statistics Essential Training course starts at the very beginning with loading in data, and then builds to show you how to “model statistical relationships using graphs, calculations, tests, and other analysis tools. Learn how to enter and modify data; create charts, scatter plots, and histograms; examine outliers; calculate correlations; and compute regressions, bivariate associations, and statistics for three or more variables.
UCLA maintains a nice webpage with instructions and examples on using R.
John Quick’s R Tutorial Series is another good starting place.
Dr. Chris Fariss also has several good resources on the “Teaching” section of his webpage.
5. Resources in the SSRMC
There are a variety of printed resources in the SSRMC to help students learn the basics of R, including:
- Art of R Programming by Norman Matloff
- Introduction to Stats with R by Peter Dalgaard
- An R and S-Plus Companion to Applied Regression by John Fox
6. Example R Code
A quick “cheat sheet of R commands can be found here. One of the most accessible resources for R questions is Quick R. The best way to find example code is to just Google what you are trying to find. There are many resources available. Here are a few we’ve found:
- A miscellaneous assortment of code for analysis and plotting.
- This website is somewhat geared towards astronomy but it provides some nice example plots as well as some general information about different types of plots with sample code.
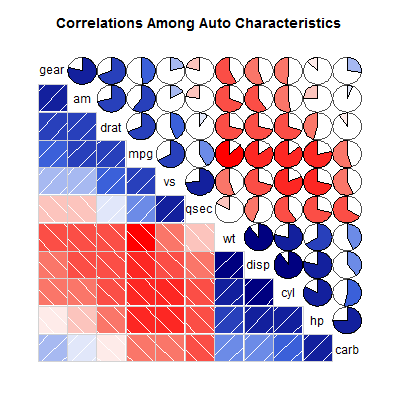
- The R graph gallery is a great resource if you have a specific type of plot in mind and want to know what the code looks like.
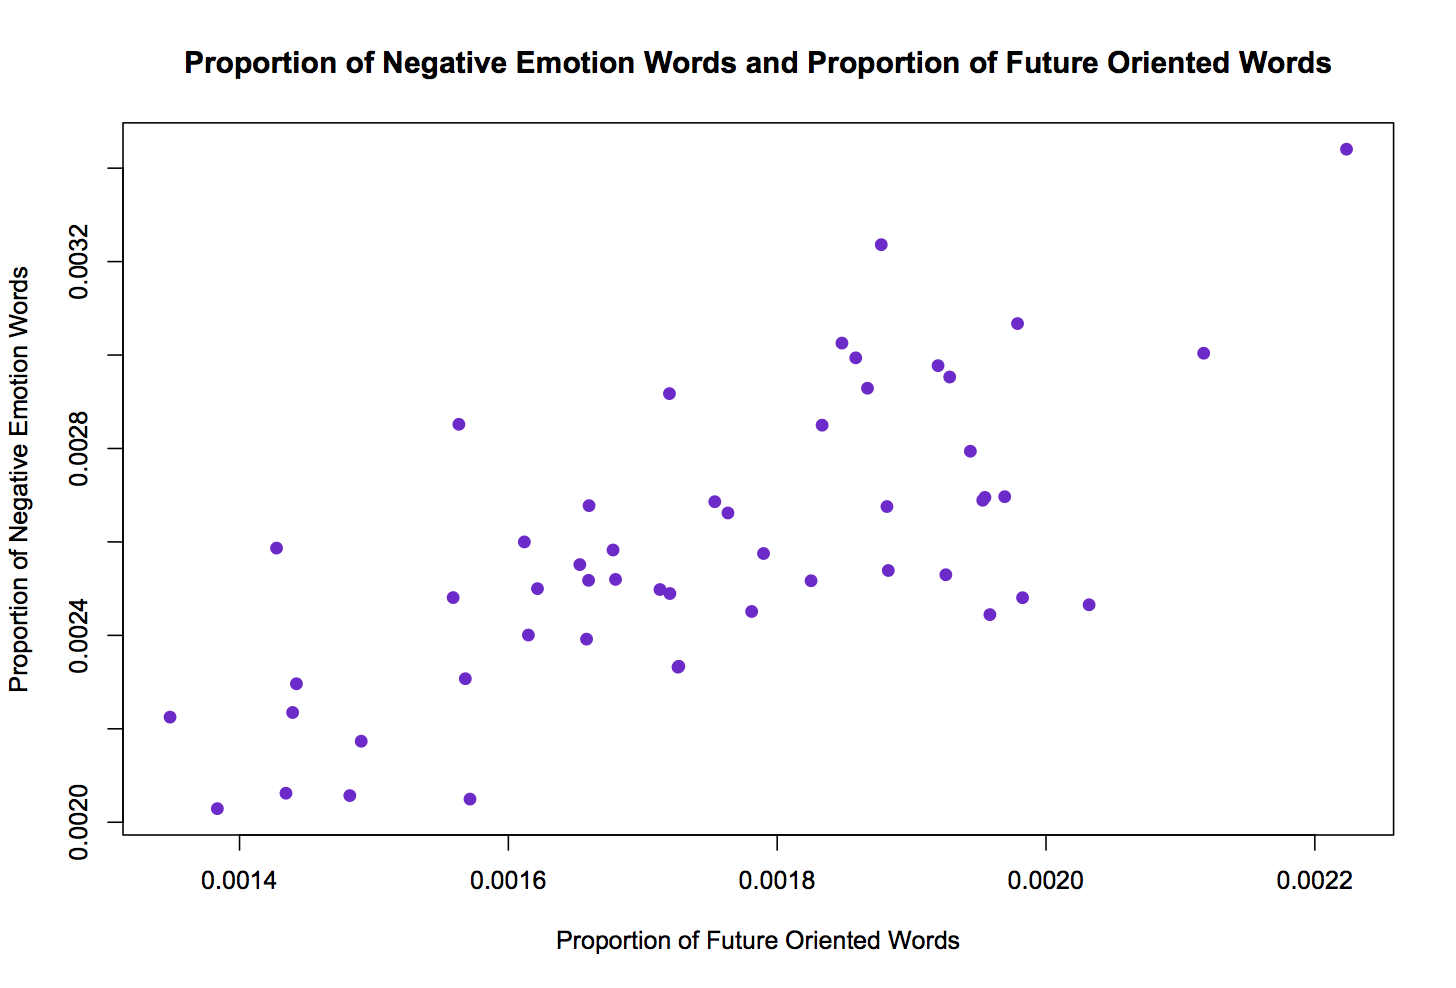
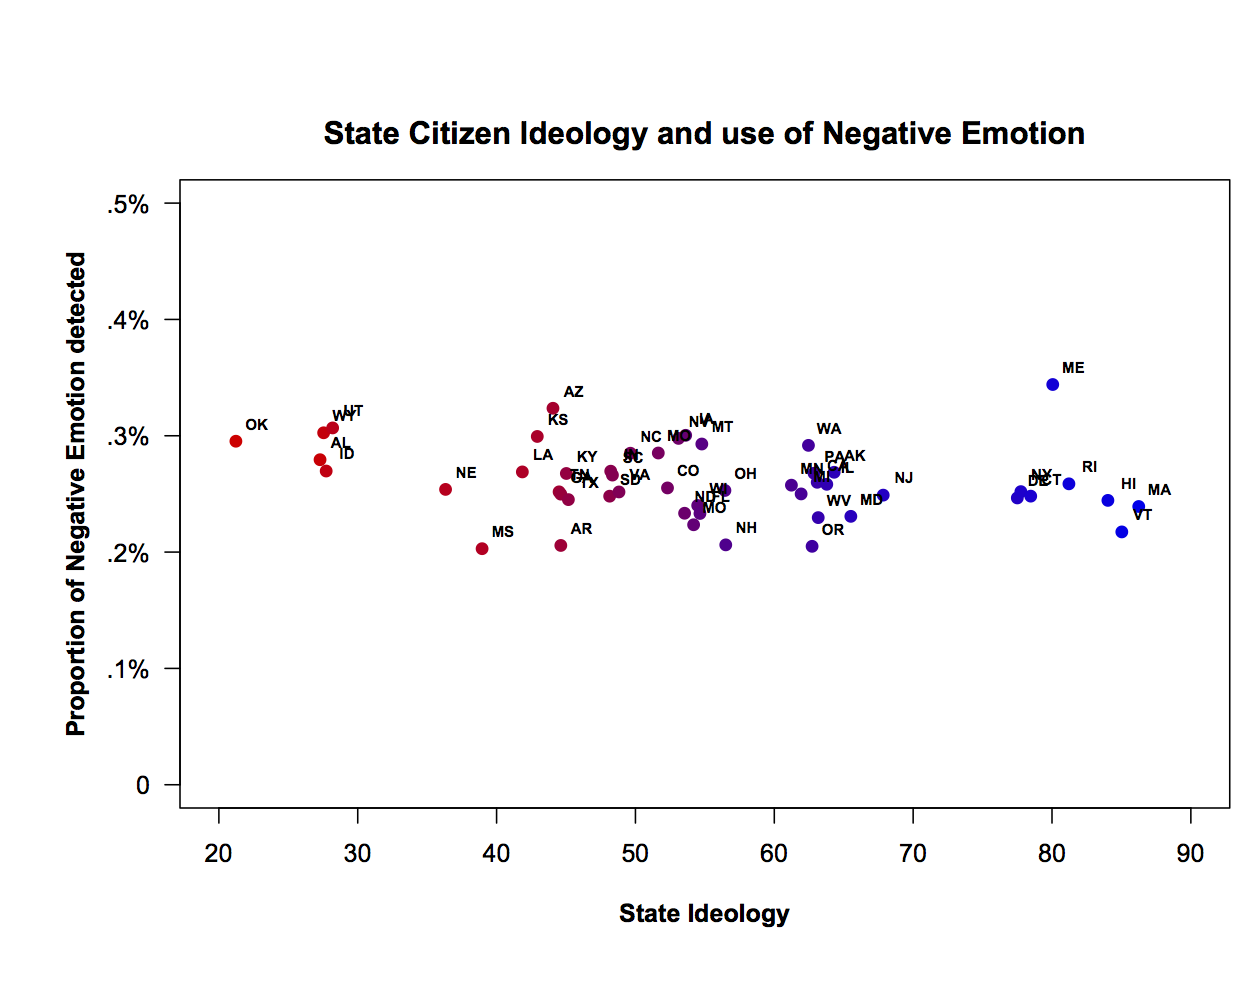
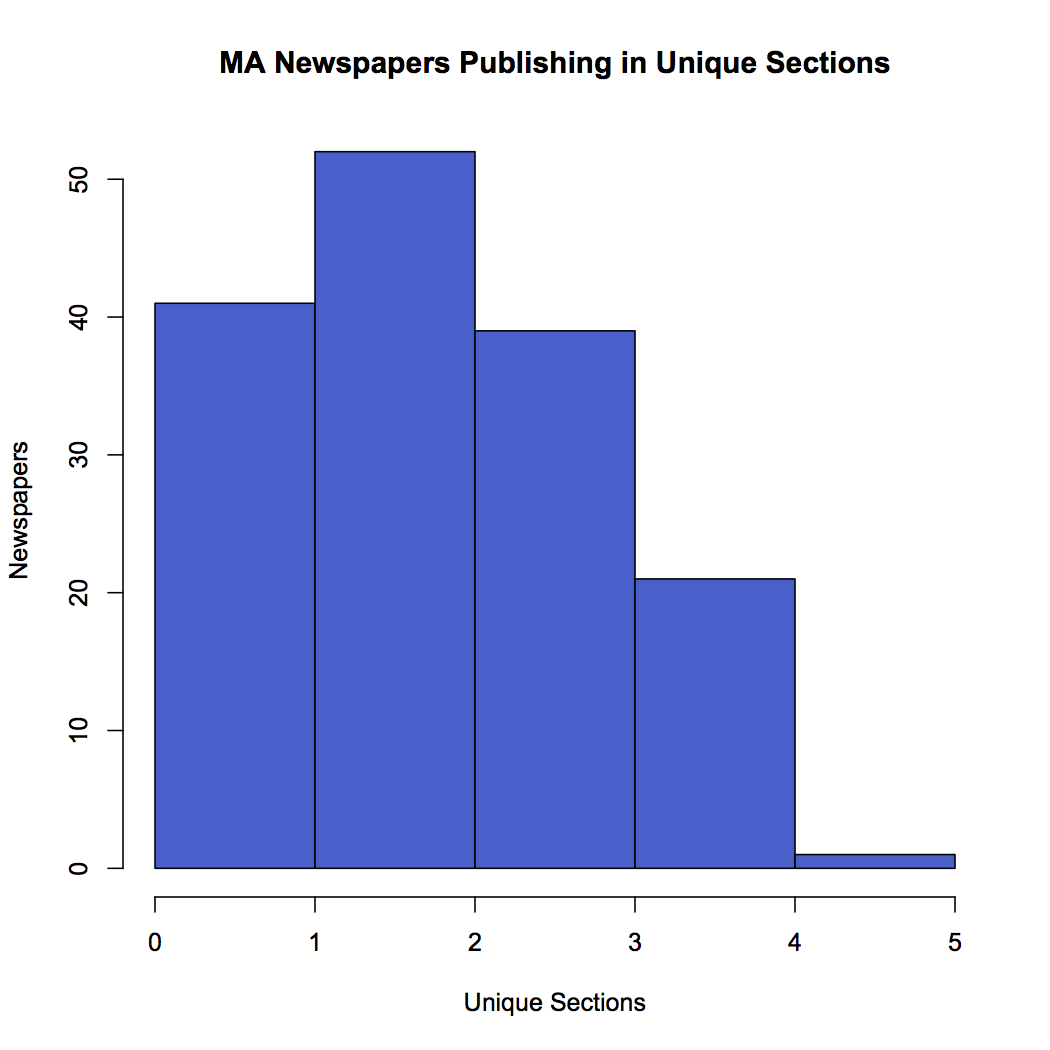
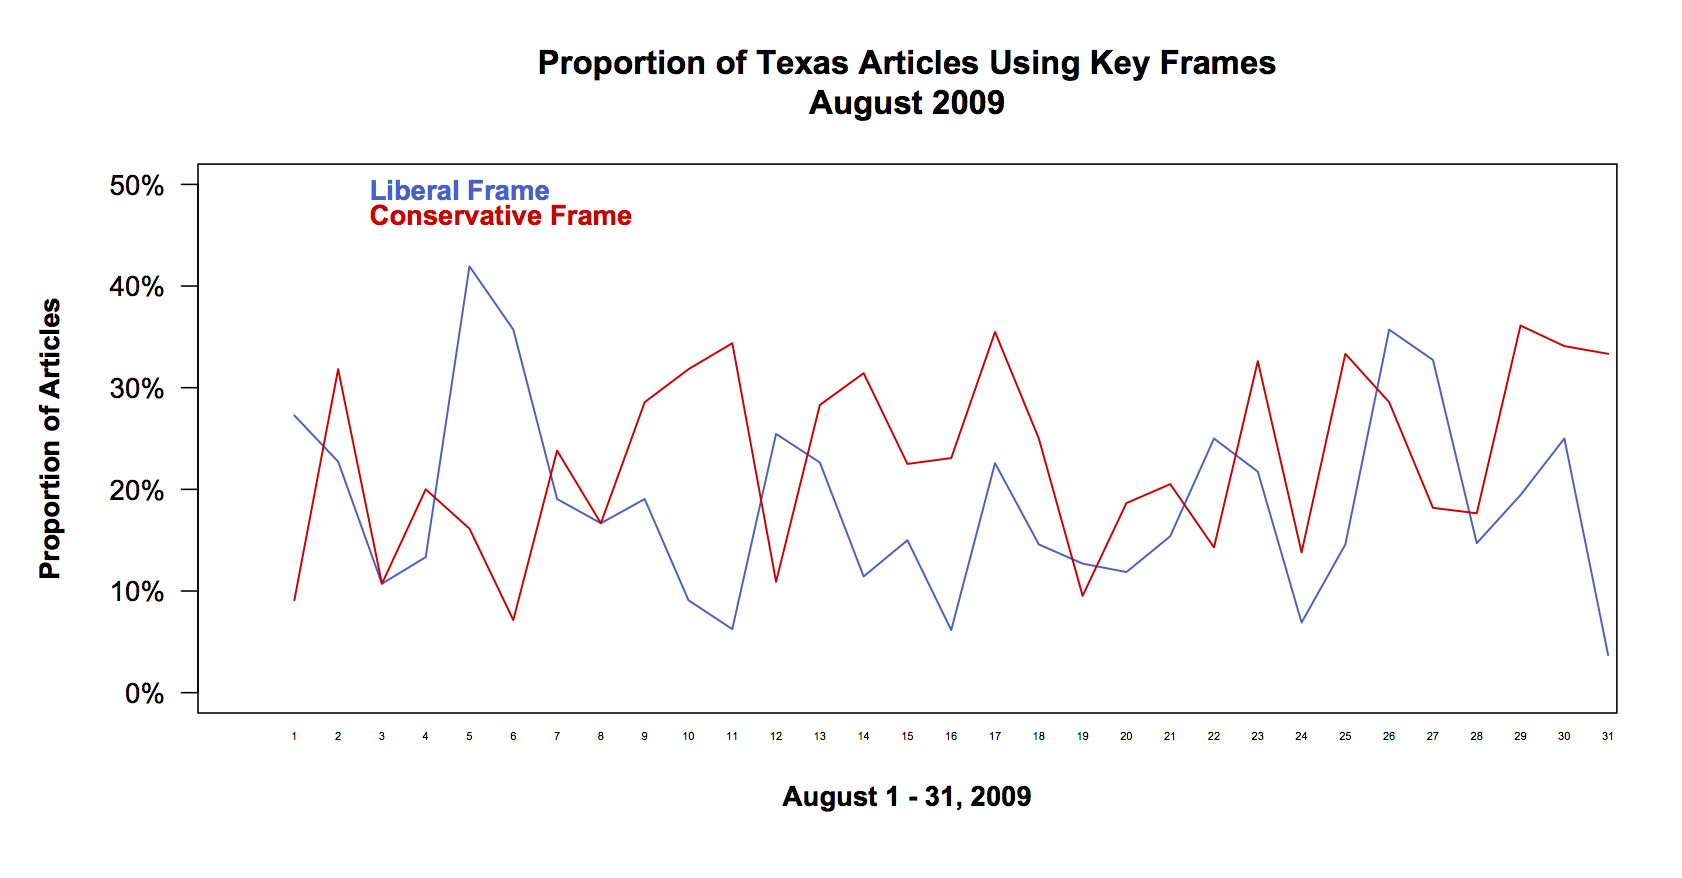
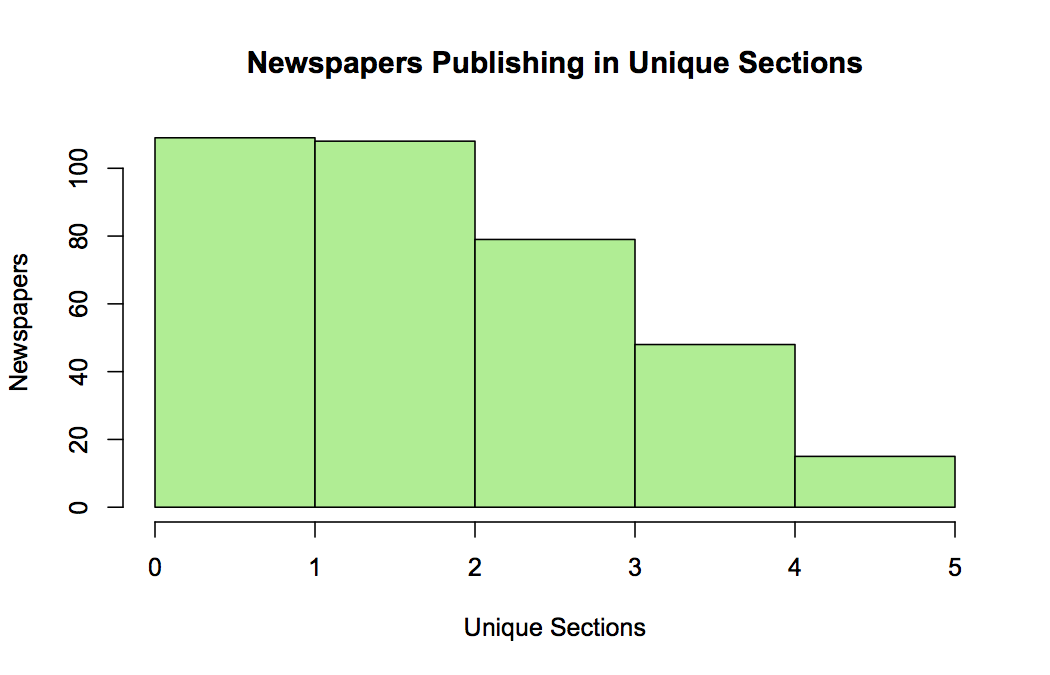
- A Compendium of Clean Graphs in R is an excellent resource for readable and informative R graphs.
7. Additional R Resources
- The videos here can help you with specific kinds of analysis you might want to perform on your data.
- R can be extended for further functionality using packages. This blog post details a few useful packages for social scientists.
- The R project is very well documented so it is always a good idea to check there if you have any questions.
- Introductory Statistics with R is another good way to get started with basic statistical analysis using R.